


Don’t Be Afraid of All-Time Highs.
While it may seem like a good idea to hold off on investing until the market is no longer at an all-time high, the data suggests otherwise. The chart below compares the average forward returns of the S&P 500 over 1, 3, and 5-year periods when investing at all-time highs versus all other days.
The data shows that returns from investing at all-time highs have, on average, been higher than those from investing on other days.
The takeaway for investors is that all-time highs do not automatically signal a decline. Rather, it shows that investing during these periods has been followed by above-average returns over 1, 3, and 5-year time horizons.
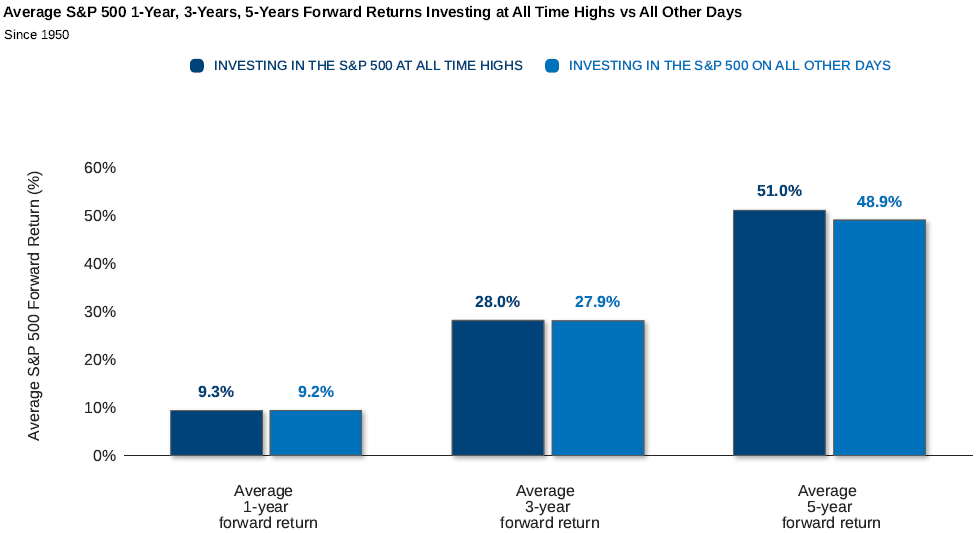
Source: ©Exhibit A, FactSet Research Systems Inc., Standard & Poor’s
Past performance is not indicative of future results, and investors should consider their own objectives and risk tolerance. Indices do not include fees, are unmanaged, and are not available for direct investment. The S&P 500 tracks the performance of 500 large-cap U.S. companies, serving as a benchmark for the U.S. stock market. The S&P weights the index by market capitalization and does not include the impact of dividends.