2015 proved a frustrating year for many investors, and a test of their patience. Full-year returns ranged from +6% in foreign small companies to minimally positive US large-cap stock and US bond positions, to downright ugly in emerging markets; volatility was prevalent across nearly all asset classes.
Developed foreign markets performed better than domestic markets through the first half of the year, but fell off more steeply in the second half, finishing slightly lower. Emerging markets were particularly weak, the result of a strong U.S. dollar, falling commodity prices – oil in particular – and China’s slowing economy importing less raw materials from other emerging markets countries.
Greece’s debt concerns resurfaced in late June, agitating investment markets yet again. Mid-August brought a broad-based global equity market correction extending into late September and, for the first time since the summer of 2011, the S&P 500 index of U.S. stocks fell more than 10% – “correction” territory.
Many media sources, not surprisingly, declared this the beginning of a disastrous fall for equities markets. We suggested to clients this was simply equities markets functioning normally, pricing for risks that were difficult to assess. When this occurs, share values naturally fall until reaching a point where willing buyers step in, comfortable they’re buying at prices likely to offer reasonable future compensation for the risk they’re assuming.
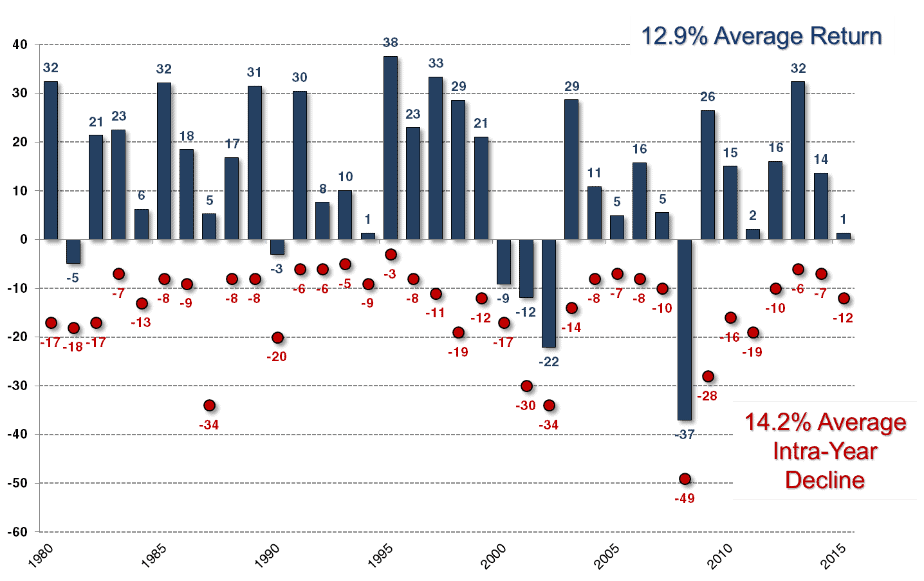
Some historical perspective on this recent decline is useful. The chart below shows, in the blue bars, the past 36 year-end total returns of the S&P 500 (different time periods will produce different results). The index’s average annual return over this period is 12.9%; evidence of why investors are willing to bear the uncertainty of equities. Interestingly, the index’s average intra-year decline (the maximum loss an investor could have experienced from a high point to a subsequent low point in the year), shown by the red dots, is 14.2% over this same period. This most recent decline is actually smaller than the average intra-year decline over this 36-year period. This made it no less painful to endure, but sheds some light on the notion that this decline was somehow different, or more severe, than others of the past.
A strong rebound in October recouped August’s losses and a good share of September’s. The fourth quarter was modestly positive, and for the full year, the S&P 500 index finished up 1.38%, developed foreign markets represented by the MSCI EAFE index finished down 0.81%, and emerging markets represented by the MSCI Emerging Markets index finished down 14.92%.
Will 2016 be better or worse? Time will tell. In the meantime, we continue to believe markets work and you’re best served by treating them as your ally rather than your adversary.
Please Note: Past performance may not be indicative of future results. Therefore, no current or prospective client should assume that future performance of his/her account will be profitable, or equal any corresponding historical index/benchmark referenced above. The historical performance results illustrated for both the comparative indices and all mutual funds reflect reinvested dividends, but do not reflect the deduction of an investment management fee, which would have the effect of decreasing indicated historical performance results. The historical performance results are provided exclusively for comparison purposes, to provide general comparative information to assist an individual client or prospective client in determining whether a certain type of asset allocation meets, or continues to meet, his/her investment objective(s).
Please Also Note: (1) a description of each of the comparative indices is available upon request; (2) performance results do not reflect the impact of taxes; (3) It should not be assumed that a client’s account holdings will correspond directly to any such comparative benchmark index; and, (4) comparative indices may be more or less volatile than a client’s Foster Group account.
PLEASE NOTE LIMITATIONS: Please see Important Disclosure Information and the limitations of any ranking/recognitions, at www.fostergrp.com/info-disclosure/. A copy of our current written disclosure statement as set forth on Part 2A of Form ADV is available at www.adviserinfo.sec.gov.