



Artificial Intelligence (AI) and semiconductor stocks have been at the center of investment news in recent years. Few companies illustrate that better than Nvidia.
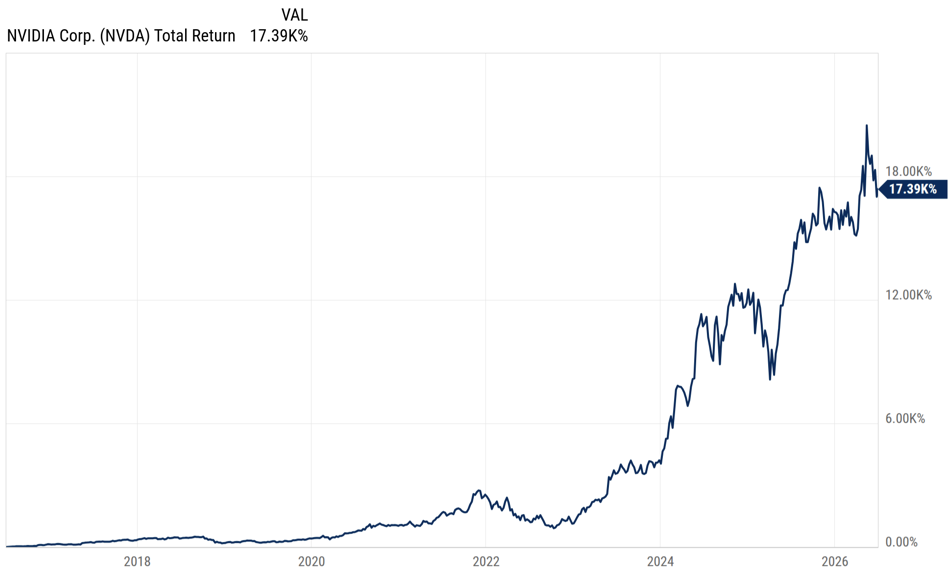
Its remarkable performance and rapid growth in market capitalization have made it one of the biggest investment stories of the past decade. Just look at the 10-year cumulative total return chart below. It’s truly incredible!
Source: Ycharts
When you see a chart like this where the stock has produced an annualized return of just over 67% in the last ten years1, it’s easy to feel like you’ve missed out if you didn’t own the stock.
A more helpful perspective is to remember that investors don’t have to identify every winning company to have a good experience. By investing in a broadly diversified portfolio, they can participate in the profits and value created by companies like Nvidia as they grow.
One way to see this is by looking at how Nvidia became a larger part of the S&P 500 over time. Nvidia isn’t a new company. It joined the S&P 500 almost twenty-five years ago, in November 2001. At that time, Nvidia replaced Enron Corporation in the index after Enron’s accounting scandal and bankruptcy and had a valuation, or market capitalization, of approximately $7.8 billion3. Roughly fifteen years later, Nvidia’s market capitalization had grown to approximately $31 billion4, and its weight in the S&P 500 had increased to just 0.15%.. Since that time, Nvidia has experienced tremendous growth and has helped power the AI revolution. Today, its market capitalization is just over $5 trillion, and it is the largest holding in the S&P 500 index, with a weight of over 7.5%5.
It might be easy to assume that Nvidia’s success was inevitable.
It wasn’t.
Over the course of its history, the company spent years fighting for survival. On a recent episode of the How I Built This podcast, Nvidia CEO, Jensen Huang, explained how close the company was to failure. From 2006-2012, he was known to say that, “our company is 30 days away from going out of business.”
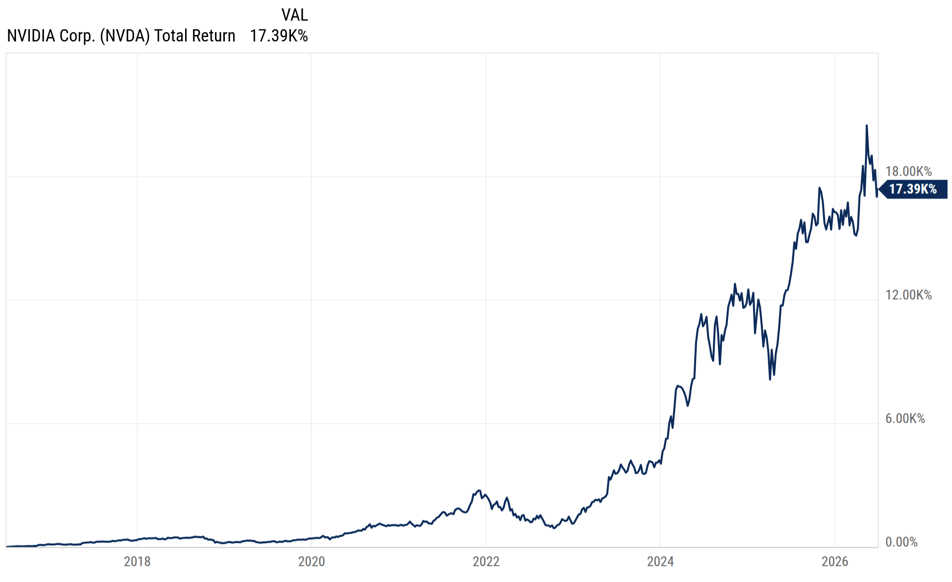
Investors who have owned Nvidia since it became publicly traded experienced significant volatility, including multiple declines of more than 50%, and a drop of nearly 90% during the dot-com bust in the early 2000s.
Nvidia Drawdown Chart – Inception to 6/30/26
Source: Ycharts
Nvidia’s story offers a few helpful reminders for investors:
- Stock markets evolve and capture new technologies and innovation.
A broad stock market index like the S&P 500 is a collection of unique, individual companies whose composition naturally evolves over time. Companies that struggle or fail, like Enron, are eventually removed, while innovative and successful companies, like Nvidia, become a larger part of the index. As a result, investors naturally participate in the growth of companies like Nvidia without needing to identify individual winners in advance. - Stock market returns have historically been driven by a relatively small number of exceptional winners.
Nvidia is a recent example of how stock markets have historically worked. A relatively small number of winning stocks has accounted for almost all wealth creation above what could be earned from cash or one month US Treasury bills over the same horizons. According to Arizona State University finance professor, Hendrik Bessembinder, “When stated in terms of lifetime dollar wealth creation, the best-performing 4% of listed companies explain the net gain for the entire US stock market since 1926, as other stocks collectively matched Treasury bills.”6 - Diversification can be valuable.
Vanguard founder, Jack C. Bogle is quoted saying, “Don’t look for the needle, buy the haystack.” By owning a diversified portfolio, investors can participate in the successes of companies that innovate and create value over time while avoiding the volatility and risk of relying on any single company to achieve their financial goals. For those wondering how the “haystack” has performed, since its inception in June of 1994, a globally diversified stock portfolio, measured by the MSCI ACWI IMI index, has produced an annualized total return of 8.65% through June of 2026, turning a $100,000 investment into $1.43M over that time frame7.
When we look back at a company like Nvidia, it might be easy to feel like you’ve missed out on its incredible returns. A more helpful perspective is to remember that investors don’t need to identify every future winner. If you’ve owned a diversified portfolio that includes the companies in the S&P 500, you haven’t missed out. Sure, you may not have experienced the same concentrated return as someone who invested solely in Nvidia, but that’s the nature of diversification. You give up some upside potential in exchange for a smoother investment experience and reduced risk of a permanent loss.
Ultimately, it’s a reminder that you don’t have to predict the next Nvidia to benefit from the advancement of new technologies like Artificial Intelligence (AI) and reach your financial goals. One of the most powerful ways to profit is by staying diversified across a broad range of companies and remaining invested over time.
Sources:
1 Bloomberg. Nvidia Corp. total return data, as of June 30, 2026. https://www.bloomberg.com/quote/NVDA:US
2 YCharts. Nvidia Total Return Price. https://ycharts.com/companies/NVDA/total_return_price
3 Los Angeles Times. “Investors Continue to Enter Enron Fray.” Nov. 30, 2001. https://www.latimes.com/archives/la-xpm-2001-nov-30-fi-9787-story.html
4 YCharts. Nvidia Market Capitalization, as of June 30, 2016. https://ycharts.com/companies/NVDA/market_cap
5 YCharts. Nvidia Market Capitalization and S&P 500 Index Weight, as of July 15, 2026. https://ycharts.com/companies/NVDA/market_cap
6 Bessembinder, Hendrik. “Do Stocks Outperform Treasury Bills?” Journal of Financial Economics, Vol. 129, No. 3, September 2018. https://www.sciencedirect.com/science/article/pii/S0304405X18301521
7 YCharts. MSCI ACWI IMI Index Total Return, as of June 30, 2026. https://ycharts.com/indices/%5EMSCIACWIIMI